Nagios is a very powerful monitoring solution that can be used to monitor the status of hosts and servers. This post is going to cover a basic setup of Nagios under Gentoo and configuring it to monitor the status of remote hosts.
First Add these lines to /etc/portage/package.use
net-analyzer/nagios-plugins nagios-dns nagios-ping nagios-ssh
net-analyzer/nagios-core vim-syntax
media-libs/gd jpeg png # You may need this line as well if your GD isn't already compiled with jpeg and png support.
Then emerge nagios
sudo emerge nagios
sudo chmod +x /etc/nagios/ # You don't have to do this but lets you ls the dir because permissions are a bit strict by default
now that nagios has been installed the next step is to enable it under apache. Edit /etc/conf.d/apache2 and add “-D NAGIOS” to the apache2 opts
APACHE2_OPTS="-D DEFAULT_VHOST -D INFO -D SSL -D SSL_DEFAULT_VHOST -D LANGUAGE -D SECURITY -D PHP5 -D STATUS -D INFO -D NAGIOS"
After doing so create a new .htaccess file in /usr/share/nagios/htdocs/ containing the following
AuthName "Nagios Access"
AuthType Basic
AuthUserFile /etc/nagios/auth.users
Require valid-user
make a copy of the file to /usr/lib/nagios/cgi-bin/.htaccess
sudo cp /usr/share/nagios/htdocs/.htaccess /usr/lib/nagios/cgi-bin/.htaccess
next create the htpasswd file and restart apache
sudo htpasswd2 -c /etc/nagios/auth.users nagiosadmin
sudo apache2ctl restart
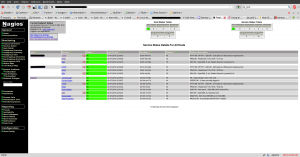
Now nagios should be configured and monitoring localhost with a number of checks, to check its working simply vist http://yourdomain.com/nagios/ and click the service details link on the menu providing everything is working you should see some service details and other status details about the localhost.
Providing everything went well we can now start monitoring some hosts remotely. There are many ways of doing so with Nagios I will cover some of these in a later tutorial but for now I will simply explain how to set up a check for PING, SSH and HTTP against a host.
Edit the /etc/nagios/nagios.cfg file and add this line any where below the log_file line.
cfg_dir=/etc/nagios/servers
next you need to create the dir /etc/nagios/servers and set it to be owned by nagios.
sudo mkdir /etc/nagios/servers
sudo chown nagios:nagios /etc/nagios/servers
now create a new .cfg named yourdomain.com.cfg and begin editing it. Add the following to the file save and exit.
define host{
    use                     linux-server
    host_name           server01.example.co.uk ; Change this to yourdomain
    address               83.XXX.XXX.XXX ; Change this to the IP of your domain
}

define service {
    use                     generic-service
    host_name               server01.example.co.uk ; Change this to your domain as above
    service_description     PING
    is_volatile             0
    check_period            24x7
    max_check_attempts      3
    normal_check_interval   5
    retry_check_interval    1
    notification_interval   240
    notification_period     24x7
    notification_options    w,u,c,r
    check_command           check_ping!100.0,20%!500.0,60%
}

define service {
    use                     generic-service
    host_name               server01.example.co.uk ; Change this to your domain as above
    service_description     SSH
    check_command           check_ssh
    notifications_enabled   0
}

define service {
    use                     generic-service
    host_name               server01.example.co.uk ; Change this to your domain as above
    service_description     HTTP
    check_command           check_http
    notifications_enabled   0
}
repeat this step for each of your hosts then restart nagios
sudo /etc/init.d/nagios restart
finally visit http://yourdomain.com/nagios/ click on the service details link again and you should see all your servers with status reports for the PING, HTTP and SSH monitoring.
Thats it for now any problems or questsions let me know I plan on covering the subject in more detail in a future post.
In the mean time some more details can be found at http://www.gentoo.org/doc/en/nagios-guide.xml and http://www.debian-administration.org/article/Using_Nagios_to_Monitor_Networks


Recent Comments