Whenever I run a screen session I always used to have top running in screen 0 by default.
This was till recently when a friend recommended `htop` to me which is a great enhancement on top and I now use this by default.
Just the other day I found another alternative to using `top` which is `nmon` although its not as customisable as `htop` it still has some good features, so I thought I would do a quick post on both and also share my configs which I think work well.
htop
 htop is an advanced, interactive system monitor process viewer designed as a replacement for the top program.
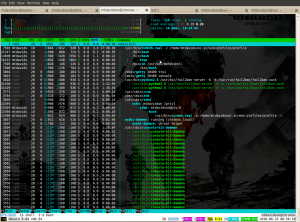
Unlike `top`, htop provides a full list of processes running, instead of the top resource consuming processes. htop also uses colour and gives visual information about processor, swap and memory status.
htop is configurable to have extra information displayed such as battery level and other information that can’t be shown with top.
Also the colouring and formatting of the top like output can be configured to improve the usability.
To install under ubuntu its simply a case of
sudo apt-get install htop
To install under Gentoo
sudo emerge htop
Below is my htop configuration which I have tweaked a bit. You can give it a go with mine or just fire up htop yourself and have a mess around with the config till you find what works for you. One of the nicest things about htop is that if you make a configuration change it automatically saves on exit.
# Mark Davidson ([email protected]) .htoprc

# Beware! This file is rewritten every time htop exits.

# The parser is also very primitive, and not human-friendly.

# (I know, it's in the todo list).

fields=0 48 17 18 38 39 40 2 46 47 49 1

sort_key=47

sort_direction=1

hide_threads=0

hide_kernel_threads=1

hide_userland_threads=0

shadow_other_users=0

highlight_base_name=1

highlight_megabytes=1

highlight_threads=1

tree_view=1

header_margin=1

detailed_cpu_time=0

color_scheme=0

delay=15

left_meters=AllCPUs Memory Swap

left_meter_modes=1 1 1

right_meters=Tasks LoadAverage Uptime

right_meter_modes=2 2 2
nmon
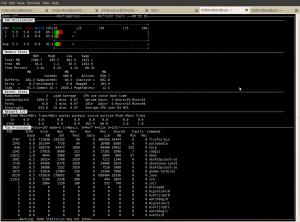
nmon is a tool designed to give a huge amount of information all on one screen. The tool can be used to get a wealth of performance statistics, allowing you to get the stats on one screen that would normally take 5 or 6 other tools.
I have only had chance to try it out recently as its only been available in the Ubuntu repository since 10.4 (Lucid Lynx).Also its not available under the Gentoo portage tree so this limits its availability quite a bit.
However it is easy to compile from source.
To install on Lucid Lynx simply `sudo apt-get install nmon`.
Once installed fire it up by just typing nmon then when the application launches press h to see the options for configuration.
I found it fairly annoying having to configure the application every time it launches. I could not find a configuration file to save the config but after reading the manual I found you can set the default behaviour using an enviromental variable.
To do so you just do `export NMON=cmknt` best to add this line to do your .bashrc to make it survive reboots etc.


Recent Comments